
Investing in Early Care and Education: The Economic Benefits for California


Press Coverage
- California’s Home Day Care Workers Win the Right to Unionize
October 11, 2019 - The Progressive
- California Allows Child Care Workers to Unionize
October 4, 2019 - American Prospect
Executive Summary
Studies consistently show that public spending on early care and education (ECE) programs is a good long-term investment for children. However, there are immediate and long-lasting economic benefits to be gained through public spending on ECE programs as well. As California mulls pathways for state funding to grow the economy, research points to ECE as a vital and powerful opportunity. Expanding high-quality ECE would not only generate economic output through the higher earnings of ECE workers, but would have an even greater impact on the state’s economy by increasing the employment, earnings, and productivity of parents.
Our report describes the current state of the ECE industry in California, including the unique challenges that require public investment in order to reap the full economic potential of high-quality ECE. In 2017-2018, California appropriated approximately $5.1 billion for ECE programs; this included state initiatives like CalWORKs and federal programs like Head Start. Cumulatively, publicly funded programs serve around one-third of current ECE enrollments, providing a crucial portion of the state’s social safety net.
This level of investment, however, is insufficient to provide high-quality ECE services to all families who need it. As providers struggle to cover the basic costs of running an ECE business, licensed capacity has fallen, including a loss of 30 percent of family child care homes since 2008. Chronically low wages drive a cycle of turnover in the workforce, restricting its ability to grow to meet demand and impeding the ability of workers to increase their skills. Public investment is needed to address these challenges.
With increased funding for ECE, California would reap immediate economic benefits, through increased economic output of both ECE workers and the parents they serve. In our report, we identify four core ways that ECE investments grow the economy:
- Dollars spent in ECE flow through the economy with a multiplier effect. At current funding levels, each dollar invested generates as much as $1.88 in increased economic activity through the output of ECE providers alone.
- Greater access to high-quality ECE would increase female labor force participation, driving economic growth and financial stability for families. The proportion of California women with children under age five who participate in the workforce was 62.4 percent in 2018, compared to 75 percent for other prime-age women. Research shows public investment in ECE can narrow this gap by increasing the workforce rates of women with young children. For example, in Washington, DC, implementation of universal pre-K increased the labor force participation of women with young children by 10 percentage points.
- When parents have access to high-quality ECE, they are able to increase their earnings. Many women in the workforce in California are breadwinners for their families, but they often take up low-wage or part-time work. Lack of access to ECE fuels this problem. Nationally, problems with child care cost parents $8.3 billion in lost wages. Investment in ECE can help working parents recoup these losses.
- ECE supports businesses’ bottom line by increasing worker productivity. Without high-quality ECE, parents often reduce work hours, turn down promotions, or quit their jobs. Turnover and absenteeism due to insufficient ECE cost businesses $1,150 per working parent each year. Research shows providing ECE decreased employee absences by 20-30 percent and reduced turnover by 37-60 percent.
Introduction
Each year, new studies affirm that high-quality early care and education (ECE) is crucial for the continued growth of our economy, setting young children on a path to better academic outcomes and professional success as adults. For each dollar of expense, studies estimate that long-term net benefits range from $7 to $17 through better educational and professional attainment (Meloy, Gardner, and Darling-Hammond 2019). In California, however, many families cannot afford the cost of high-quality ECE programs on their own. As a result, insufficient access to ECE causes California to miss out on a broader set of immediate and long-lasting economic impacts, particularly for women: mothers’ labor force participation, earnings, and productivity are unable to reach their full potential without sufficient public investment.
California’s current level of public spending on ECE programs is too low to meet the needs of families and recruit and retain sufficient numbers of high-quality teachers and providers. As of 2017, licensed ECE capacity could only support 23 percent of children in working households (DiMatteo 2017). Meanwhile, many ECE teachers earn less than $13 per hour, and nearly one third of family child care providers have closed their doors since 2008. Friend, family, and neighbor providers in some counties who receive state subsidies may earn as little as $3 per hour (“License-Exempt Child Care” 2019). Licensed capacity continues to fall, as low wages fuel teacher turnover (Austin, Edwards, and Whitebook 2018).
Numerous studies have shown that spending on ECE programs is a good long-term investment for kids. Our study finds that increased investment would also generate immediate and long-lasting economic benefits for California. Some of these benefits result from the ECE industry employing more teachers and paying higher wages, as their additional spending drives economic growth. Expanding high-quality ECE, however, would have the greatest immediate impact on the employment, earnings, and productivity of parents in the state’s economy. As an example, a study of Washington, DC’s preschool expansion found that the increased ECE enrollment led to a 10-percentage point increase in mothers’ labor force participation (Malik 2018). An increase of this magnitude among women with young children in California would potentially bring in hundreds of thousands of additional workers into our labor force.[1]
In this paper, we provide an overview of California’s ECE industry in its current form, describing its benefits and challenges. We also describe the significant economic impacts to parents, providers, and the California economy of expanded public investment.
Overview of the ECE Industry in California
Early care and education, or ECE, encompasses an array of programs and services. Participants include infants, toddlers, and preschoolers enrolled with licensed providers; school-age children participating in out-of-school time programs; and young people age 0 to 12 receiving paid care from a friend, family member, or neighbor.[2] ECE programs largely fall into one of two categories: license-exempt or licensed care. While there is considerable variation across both categories of providers, long-term research shows high-quality licensed care leads to greater educational and professional attainment for children (Stipek 2018). Both types of programs, however, offer benefits to families.
In this section, we provide a description of the industry, including the characteristics of providers and California’s current public investment in ECE.
We estimate that approximately 405,000 children in California, or about one third of all children receiving paid care, are in a license-exempt arrangement.[3] This number includes 45,000 children receiving subsidies. Exempt care includes private nannies and paid friend, family, and neighbor (FFN) arrangements, as well as public recreation programs and some school-based aftercare. Since 2014, the federal government requires basic health and safety training for exempt providers compensated through the Child Care and Development Fund (“Monitoring License-Exempt CCDF Homes” 2015). Otherwise, exempt care in California is largely unregulated, meaning that families can choose a caregiver regardless of the level of education, training, or experience they provide.
Some parents seek out exempt care due to its greater flexibility and cultural relevance. For instance, a family member or private nanny may be able to support parents’ non-traditional work hours better than a program running during the business day. Alternatively, a parent may value the low adult-to-child ratio, since many FFNs care for only one or two children. Turning to an exempt provider may also be the easiest option when a family must find child care quickly, since licensed facilities often have application processes and waiting lists (San Francisco Parent Voices Meeting 2018).
However, there are drawbacks to exempt arrangements: providers have a wide range of educational backgrounds and experience in child care, and there is no system that monitors or supports their development. Research offers mixed findings on the continuity and quality of FFN care (Susman-Stillman and Banghart 2011). Some localities offer free activities to support FFN providers, though the workshops and services remain optional (“FFN Caregiver Workshops” 2019).
Licensed Care
Licensed providers, meanwhile, operate within a complex framework of standards and regulations. Obtaining a license means first adhering to state laws on child health and safety. Depending on the setting and type of funding, there may be additional requirements, such as a maximum adult-child ratio, staff qualifications, and developmentally appropriate activities. The Child Care Licensing Division of the Department of Social Services manages and enforces the state’s system. Once a provider is licensed, they may opt in to Quality Counts, California’s program for evaluating and supporting ECE quality improvement (Stipek 2018).[4]
There are two settings of licensed ECE: center-based care (centers) and family child care homes (FCCs). The programs differ in their size, adult-child ratios, and staff qualifications. State regulations stipulate that FCC providers may serve up to 8 children, or 14 in a large home if they maintain ratio by employing an aide. Limits are lower if the children are predominantly or exclusively infants. Centers, meanwhile, may serve more children as long as they follow the age-based ratios – for instance, one teacher may observe 12 preschool-age children, or 18 children with an aide present (Stipek 2018).
In 2017, California’s network of licensed ECE providers included 38,389 centers and FCCs, with a total capacity of 991,000 potential spaces. Providers may serve a mixture of unsubsidized and subsidized children, with the latter receiving funding through contracts such as California State Preschool or vouchers like CalWORKs. Statewide, overall licensed capacity can only support up to 23 percent of children age 0 to 12 in families where all parents work. The proportion varies regionally, however, with a low of 11 percent in Kings County and a high of 62 percent in Modoc County as shown in Figure 1 (DiMatteo 2017).[5]

Based on a recent analysis of the 2012 National Survey of Early Care and Education (NSECE), we estimate 705,000 children enrolled in center-based care and 195,000 in family child care homes in California in 2016-2017.[6]
Transitional Kindergarten
California began serving children through Transitional Kindergarten (TK) in school districts in 2014. TK accepts children regardless of income eligibility, providing a school-year program for children who turn five years old in September through December – after the birthday cutoff for traditional kindergarten.[7] Unlike centers and FCCs, TK employs certificated teachers and follows similar regulations to kindergarten. Consequently, classrooms have as many as 30 children. A 2017 evaluation found that TK classrooms averaged 20 students, with roughly half of the programs employing an aide for at least part of the school day. Roughly two-thirds of programs operate on full-day schedules (Manship et al. 2017). These classrooms served approximately 90,000 children in the 2016-2017 school year (“Transitional Kindergarten Data” 2018).[8]
Funding of Public ECE Programs
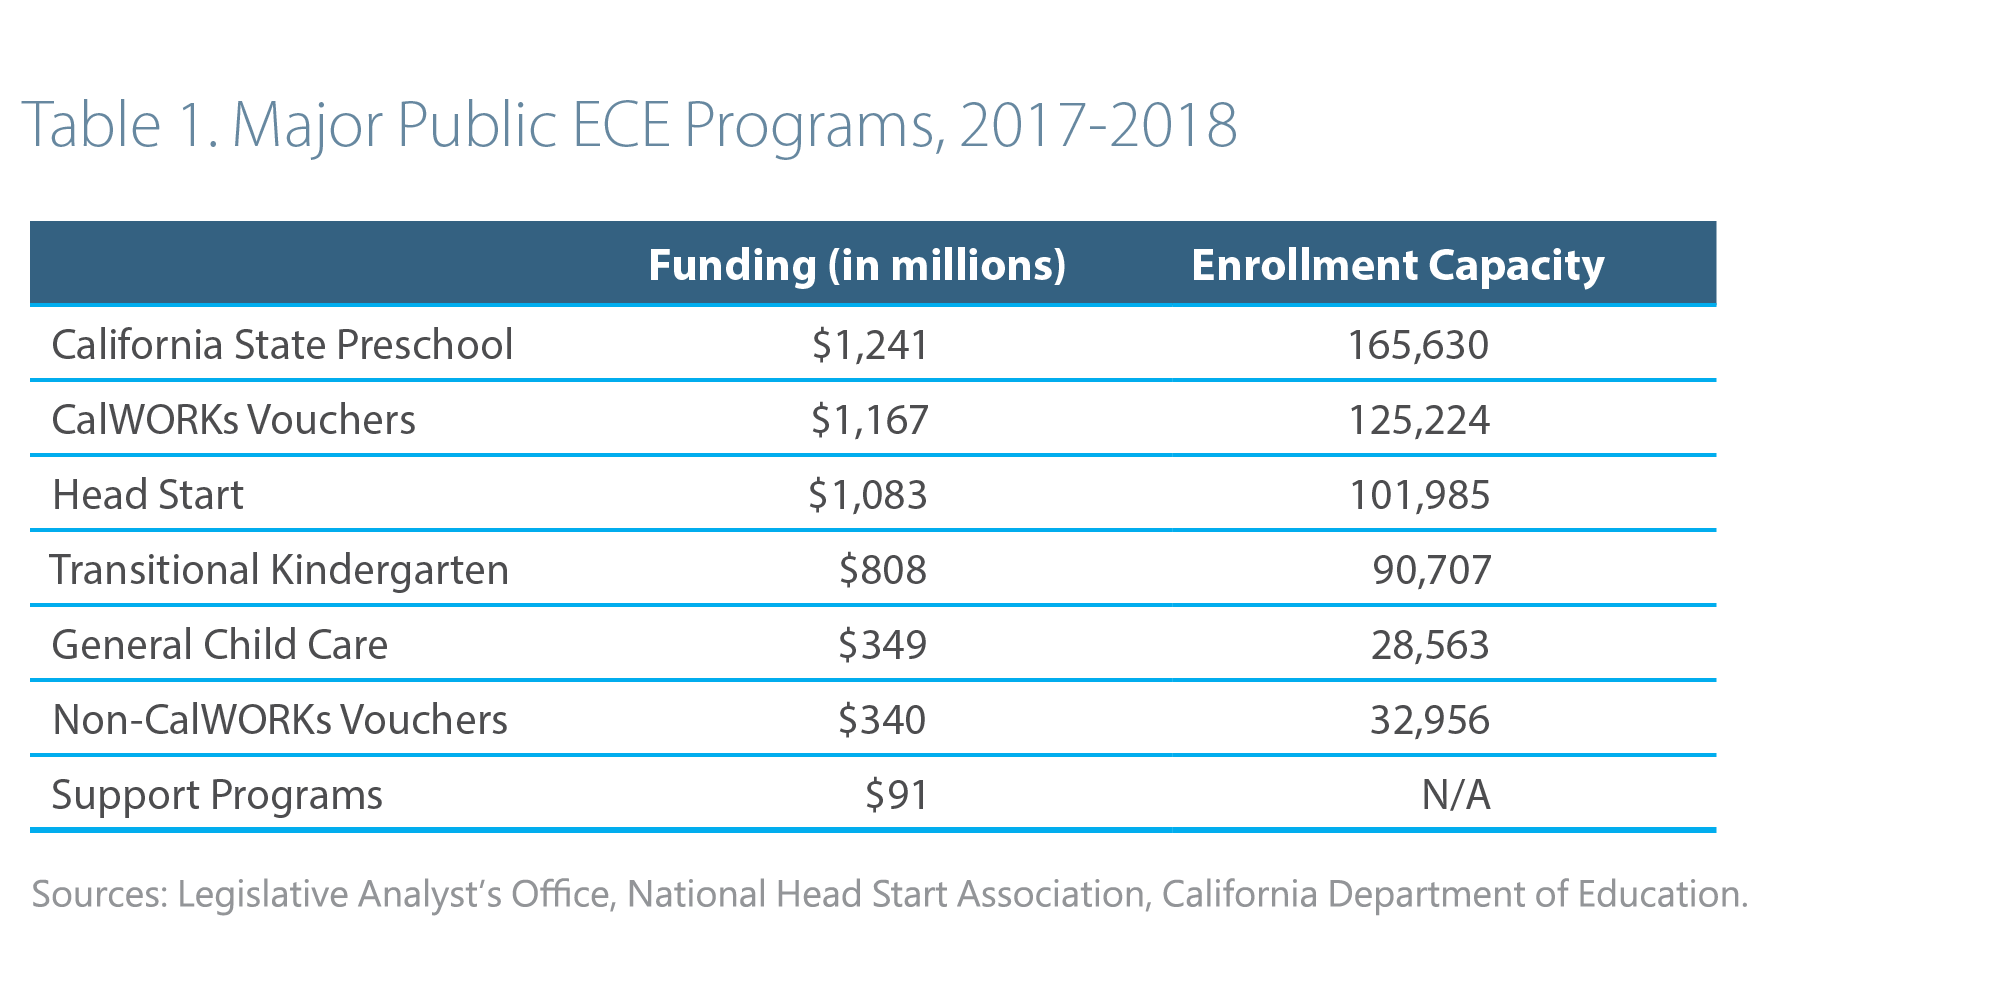
To create subsidies for low-income families, California allocates a mixture of federal and state dollars across eleven different funding streams. These include State Preschool, CalWORKs, and Transitional Kindergarten. Each stream comes with its own mandate for program oversight. For instance, CalWORKs funding is disbursed in the form of vouchers, which families may spend with either licensed or license-exempt providers. Centers and schools contract directly with the Department of Education for State Preschool funding. Transitional Kindergarten (TK), by contrast, operates solely within school districts with funding from the Local Control Funding Formula (LCFF). In all, ECE appropriations totaled $5.1 billion in the 2017-2018 budget year (“2017 California Head Start Profile” 2017; Petek 2019). Table 1 shows the breakdown of funding across major public programs.
Currently these funding streams are insufficient to provide public assistance for all eligible low-income families. Approximately 1.6 million children are eligible for a subsidy but unable to obtain one. Moreover, more than 130,000 children currently participating in state-funded ECE receive part-day care (Schumacher 2019). Part-day State Preschool, for instance, operates only three hours per day, and two thirds of programs are housed in school districts and operate only 180 days per year. Many families in part-day programs rely on multiple child care arrangements, suggesting public investment in full-day programs may offer superior coverage (Stipek 2018).
Increased Investment in ECE is Necessary to Meet the Need for High-Quality Care
Studies on the effectiveness of ECE point to quality as a key driver in generating long-term benefits for children. Compared to participants in lower quality or informal ECE, children in high quality ECE programs went on to experience improved graduation rates, earnings, and health – with an additional reduction in interactions with the criminal justice system among male participants (McCoy et al. 2017).
Programs that align with high-quality features can boost children’s learning. However, market forces in the ECE industry are unable to sustain a system that meets these qualifications without government investment. In this section, we describe several challenges with California’s ECE system that suggest that current funding levels are not sufficient to meet families’ needs.
Increased Public Investment is Necessary to Expand ECE Supply
First and foremost, the scope of the current ECE system is too small to serve California’s young children – even when considering only the families where all parents are employed, thus having potential need for ECE. Among the 4.2 million children age 0 to 12 in working households, less than one third participate in paid ECE. Figure 2 shows the distribution of annual ECE enrollments, including subsidized and unsubsidized care. This leaves significant potential need for paid child care, including 1.6 million children with low-income, working parents who are eligible for a subsidy but do not receive one.[9] These figures may still understate the total need for ECE, since they exclude parents who could enter the workforce if access to programs increased.

Constraints in the supply of licensed providers limit overall access to ECE. While in 2008 licensed providers had the capacity to support up to 27 percent of children in working households, today’s system can accommodate only 23 percent of that group (DiMatteo 2017). Between 2000 and 2008, the number of licensed providers and total capacity for enrollment were increasing; however, during the Great Recession, growth in center-based capacity slowed, while family child care saw a steep decline that has continued to the present day (see Figure 3). Overall, the number of licensed FCC facilities has declined by 30 percent since 2008 (DiMatteo and Nzewi 2019).

According to a 2018 survey of FCC providers, many have been unable to make ends meet since the Recession. Among programs that have stayed open, 20 percent of respondents reported low earnings as their greatest challenge. Meanwhile, among those that closed down, most ranked family circumstances, better employment options elsewhere, or housing costs as their primary concern (DiMatteo and Nzewi 2019).
The decline in ECE undermines growth in California’s economy: providers’ revenues and output are lost, and parents are unable to participate fully in the workforce. As explained in the sections below, public investment will be necessary to reverse the decline in the supply of ECE providers.
Increased Public Investment is Necessary to Finance the True Cost of High-Quality Care
The current levels of public spending per child are not sufficient to cover the true cost of high-quality care. Managing a center or family child care home comes with significant operating expenses. In addition to purchasing materials and food to operate their businesses, programs must maintain sufficient staffing and space to meet the requirements of licensing. A 2018 report on center-based care estimates the annual cost of serving a preschool child at $9,852 and an infant at $17,964 in California. Both estimates assume around $2,800 per enrollee goes to rent, utilities, and classroom materials each year; serving an infant, however, more than doubles the cost of labor and administration. (Workman 2018). Lower adult-to-child licensing ratios in infant care are a main driver of this expense: providers must have twice as many teachers for infant care. This study echoes the conclusions of cost modeling research on ECE businesses, which show that enrolling preschoolers is more financially viable for covering the cost of care (Alliance for Early Childhood Finance 2016).
After covering their basic expenses, ECE providers who care for children with subsidies are typically left with very low earnings, leaving many to finance quality improvements at the expense of their wages. Moreover, ECE providers typically experience fluctuations in their earnings, as they may not receive the full reimbursement rate each month if they are unable to keep up with reporting requirements or if children are absent (Mitchell and Stoney 2010). Together, these factors create a strong incentive for providers to leave the industry and discourage new providers from entering. Increased public funding would enable ECE providers to not only meet the basic requirements of daily operations and earn a sustainable income, but also to invest in high-quality training and materials.
Currently, state subsidies provide varying levels of funding. State licensing creates different standards for provider types – including staff qualifications, teacher/child ratios, and class sizes. Correspondingly, there are disparities in reimbursement by age and setting. Even among full-day programs serving preschool-age children, however, there are differences in reimbursement (see Figure 4): some programs receive the standard reimbursement rate (SRR), while others receive the regional market rate (RMR) or State Preschool rate (EdBudget 2018).

By design, the RMR fluctuates by county to adjust for the cost of living, based on the 2016 Regional Market Survey of providers. An updated survey is scheduled for 2019 to refresh the rate (DiMatteo and Nzewi 2019). The SRR, meanwhile, remains uniform statewide. In most counties, the SRR exceeds RMR for infants but falls below for preschoolers based in centers. The SRR and State Preschool funding, however, require developmentally appropriate curriculum and higher staff qualifications – meaning some preschool programs must meet a higher level of quality with a lower level of funding (Taylor 2017). This misalignment creates a provider disincentive to accept subsidies with the SRR or State Preschool rate. As a result, programs fail to take up all of the funding. Within State Preschool appropriations, for instance, nearly 12 percent of the budget goes unused. Providers may prefer to enroll unsubsidized children, since the state does not impose quality standards on their care (Melnick et al. 2017).[10]
Legislators have proposed reforming reimbursement rates to create a single payment structure, eliminating the disincentive to meet higher standards (Levya 2019, 1). However, even raising all rates to the current upper bound would be insufficient to cover the cost of high-quality delivery. A 2018 report estimated that high-quality infant care would require $31,100 in a center – nearly twice the 2016-2017 regional market rate of $16,452. Paying for high-quality care, meanwhile, would support lower teacher-child ratios, higher staff salaries, greater space, and more resources. Studies of ECE confirm that these features can improve children’s learning outcomes (Workman 2018).
The City and County of San Francisco has developed a local funding model that attempts to simultaneously increase supply and improve quality of ECE. In 2017, they launched the Early Learning Scholarship, a system combining local and state funding streams. San Francisco’s current model provides funding to meet the standards of a Tier 3 quality ranking, the middle level of the scale for measuring child development, teacher qualifications, and program management. According to San Francisco Fiscal Strategies Manager Tony Tyson, a more advanced version of the funding model would include increases for the higher quality rankings (Tyson 2018).[11]
To ensure providers can cover both basic operating expenses and quality improvements while still earning a sustainable income, California could adopt a similar model to San Francisco. By increasing the base level of reimbursements and linking it to a quality rating or standard, the state government would make running an ECE program economically feasible.
Increased Public Investment Is Necessary to Recruit and Retain ECE Teachers
A wide range of studies has established a connection between low wages and high turnover, including within ECE occupations specifically (Whitebook and Sakai 2003). We estimate that approximately 85,000 individuals are employed in ECE as child care workers, preschool or kindergarten teachers, or teacher assistants in California (Austin, Edwards, and Whitebook 2018).[12] Statewide, turnover rates are high – around 22 percent for lead teachers and 24 percent for assistants, with even higher rates in some regions like Los Angeles (Zepeda 2015). This suggests that wages are currently too low to retain sufficient numbers of qualified ECE teachers (Porter 2012).
According to a 2018 report, the median wage of California child care workers is only $12.29 per hour, and $16.19 for preschool teachers (Whitebook et al. 2018).[13] As shown in Figure 5, these wages are far below a living wage for a single parent (Glasmeier 2019).[14] These survey estimates of ECE wages, however, do not capture most home-based or license-exempt providers. The former group are self-employed and earn an estimated median wage of $8.28 per hour (Thomason and Bernhardt 2016).[15] Moreover, wages for license-exempt providers vary considerably. In-home nannies in private households have an estimated median wage of $15.17 per hour (Schulte and Durana 2016). By contrast, the California Resource & Referral Network estimates that, in some counties, family, friend, and neighbor providers earn as little as $3 per child per hour when they accept ECE vouchers through programs like CalWORKs (“License-Exempt Child Care” 2019).[16] Meanwhile, a teacher who is a single parent would need to earn at least $30.23 an hour to cover their household expenses (Glasmeier 2019). The persistence of low wages means 58 percent of the ECE workforce takes up one or more forms of public assistance like MediCal or CalFresh, and some even take on a second job to make ends meet (Whitebook et al. 2018).

In order to expand the ECE workforce, raising wages will be necessary.[17] The 2019 California Assembly Blue Ribbon Commission on Early Childhood Education recommends establishing wage increases tied to educational attainment to help retain staff by making ECE positions more attractive and financially viable (CA Assembly Blue Ribbon Commission on Early Childhood Education 2019). With increased public investment, teachers could also begin earning a living wage – potentially reducing enrollment in social safety net programs like MediCal or CalFresh.
Higher wages would also reduce churn in the workforce. Research shows an association between lower turnover and higher program quality, with measurable effects on children’s development where turnover is below 10 percent of teachers. Differences in tenure and educational attainment play a role: inexperienced teachers, for example, lack specialized training, so they are very responsive to small wage increases or improved working conditions in other professions; in contrast, as teachers advance their education, they may be able to gain employment as a salaried kindergarten teacher, thus leaving ECE centers or homes for school districts (National Research Council 2012).
According to a national report, low compensation deters ECE teachers from seeking higher levels of education, and professional development opportunities do not translate to higher pay. Public investment in wages would not only increase retention rates, but also encourage teachers to continue their education and training (Institute of Medicine and National Research Council 2015). Several studies have demonstrated that wage parity with kindergarten teachers creates a strong and high-quality workforce. For example, Abbott School Districts in New Jersey created a scholarship program to increase the educational attainment of preschool teachers, ultimately allowing pay parity with kindergarten (U.S. Department of Health and Human Services 2016).
Increased Public Investment is Necessary for Parents to Afford the Cost of Quality
Not only do providers struggle to bring in enough revenue to earn a sustainable income and provide quality care, but families also struggle to afford the cost of ECE. California ranks as one of the least affordable states for licensed care for parents (Child Care Aware 2018). In 2016, the average annual cost was $8,458 with an FCC and $11,735 in a center.[18] As shown in Figure 6, these costs have escalated over time.

High costs are especially burdensome for low-income families. Some parents who earn at or below 70 percent of state median income (SMI) are eligible for financial assistance, limiting their obligation to a copay of only a few hundred dollars per month. For a family with earnings around the 70 percent SMI threshold, the copay would amount to only 10 percent of their monthly budget (DiMatteo 2017). However, only a third of income-eligible children currently have access to subsidies (Melnick et al. 2017). Without assistance, enrolling one child in a center would cost the same family 24 percent of their income.[19] Public investment will be necessary to expand subsidies to more low-income families, especially as providers strive to sustain high-quality programs.
Middle- and upper-income parents may be able to afford the market rate in a center or FCC more readily than their low-income peers. However, the median family with working parents would still devote 15 percent of their income to enroll one child in center-based care. Many take up license-exempt care, including nannies or nanny shares. According to a 2018 study, full-time nanny care for a child under age five costs more than $31,000 per year in California (Schulte and Durana 2016). For the median two-parent household, this expense would consume 28 percent of their earnings – and it may or may not lead to quality care.[20] As providers continue to invest in high-quality training and resources, public funding will be necessary to avoid burdening families whose budgets are already constrained.
Increased Investment in ECE Would Create Jobs and Grow California’s Economy
Taken together, the shortcomings of California’s ECE system leave many parents without access to high-quality ECE. Studies demonstrate that the inadequate access creates a drag on the state’s economy. Increasing public investment in high-quality ECE, by contrast, would stimulate growth. One impact of more funding would be to generate greater revenues for providers, sending ripples of increased activity through the region through an economic multiplier effect. The biggest benefits of ECE expenditures, however, are the increased employment, earnings, and productivity of parents – an unrealized source of potential gains for California’s economy. In this section, we explore the current impact of the ECE industry and discuss ways in which increased public investment could unlock these economic benefits.
ECE Revenues Generate an Economic Multiplier Effect
Currently, California’s ECE industry generates $13.5 billion in gross receipts each year. Approximately $7.9 billion in revenues accrue to center- and school-based providers, while $1.6 billion go to family child care and $4.1 billion to license-exempt care.
We use IMPLAN, a modeling software package, to simulate how these dollars reverberate through California’s economy. Revenues in ECE cause two types of economic impacts on the supply side: ECE providers consume $13.5 billion in goods and services as they operate their programs (direct output), generating approximately $4.3 billion in output in other industries (indirect output); and teachers spend their earnings on food, housing, and other household expenses, generating $7.6 billion throughout the economy (induced output). Cumulatively, the ECE industry in California generates $25.4 billion in economic output—as well as $1.1 billion in state and local tax revenue (see Figure 7). See Appendix II for our methodology.

Put simply, we estimate that $13.5 billion in input does not merely trigger an equivalent level of output within the ECE industry, but rather generates a total of $25.4 billion of economic activity throughout California. This means that every dollar spent yields a multiplier of $1.88 dollars in economic output, plus an additional $0.08 in state and local tax revenue. Increasing public investment in ECE – resulting in, for instance, increased teacher compensation and retention – would cause a similar ripple effect.
The net economic effect of additional spending on ECE would depend on how the state were to finance the programs. Research by Bartik and others suggests that financing ECE programs through tax increases focused on the top end of the income distribution would result in a large net positive effect on employment and economic growth, even before considering the parent-specific effects on the economy discussed in the section below (Bartik 2017; Jacobs, Lester, and Lucia 2010).
ECE Supports Parents’ Labor Force Participation
Our estimate of the multiplier of ECE revenues demonstrates how revenues flow through providers to grow California’s economy. Access to ECE, however, generates broader benefits to California’s economy: parents – mothers in particular – are able to participate more fully in the workforce, generating higher earnings and greater productivity.
California’s economy grows as its workforce expands, generating new activity and earnings.[21] The current rate of female labor force participation, however, lags behind countries with greater access to ECE. In 2010, the United States ranked 17th out of 22 among OECD countries with its female participation rate of 75.2 percent – compared to Sweden’s 87.5 percent. A recent study found that “family-friendly” policies like paid leave and public child care spending have had greater traction in other developed countries – driving approximately 28 percent of the female labor force gap between the US and its peers (Blau and Kahn 2013).
In California specifically, 62.4 percent of prime-age women with children under age five took part in the workforce in 2018. This labor force participation rate was growing in the years leading up to the Great Recession, where it stayed relatively constant until 2017.[22] By contrast, 75.0 percent of other prime-age women were employed or seeking work (Figure 8). This trend reveals that California continues to lag in supporting its working mothers with young kids, leaving an untapped population of hundreds of thousands of potential workers.[23] Public investment in ECE could help California address this challenge.

Some mothers may prefer to act as primary caregivers for their child’s early years. Public opinion polling, however, suggests many women would prefer to work. Only half of stay-at-home mothers in a 2012 survey felt their situation was “ideal” for young children. Many of them pointed to part-time work as a preferred option for balancing family and career during the early childhood years (Cohn et al. 2014). Similarly, a 2018 survey of mothers found a striking interest in joining the workforce among homemakers: according to the research, half expressed interest in “looking for a job” if they could first obtain more affordable ECE (Schochet 2019).
Researchers have examined women’s responsiveness to the cost of child care over time, deriving a wide range of estimates depending on the methods used. Among single mothers, for example, studies in the 1990s estimated that for every 10 percent increase in the cost of ECE, women’s labor force decreases between 0 and 13.6 percent (Sall 2014). Researchers attribute the variability in estimates to the problem of non-random samples, making it challenging to distinguish the true effect of rising prices on women’s employment. The estimates, however, point to a relationship between rising costs of care and reduced employment. A 2018 study took a different approach, simulating a life-cycle model of family decision-making and budgeting. The author estimated that the rise in prices for ECE since the 1990s accounts for 13 percent of the decline in employment among American mothers with children under age five (Cascio 2017).
While data suggests that inadequate access and high costs in ECE have undermined women’s labor force participation, quasi-experimental studies have shown that state and local expansions in pre-K can have a positive effect. A national 2013 study of Census data compared regions before and after a pre-K expansion, finding labor force participation grew by 3.8 percentage points for single mothers and 4.3 points for married mothers (Sall 2014).[24]
In Washington, DC, an expansion of pre-K led to an increase in labor force participation on a much broader scale. In 2009, the District rolled out full-day, universal pre-K in its public school district. By 2016, 77 percent of three- and four-year-olds were enrolled. After controlling for changes in demographics, a 2018 study of the program found it generated a 10 percentage point increase in the maternal labor force participation rate since its inception, suggesting around 2,500 women gained employment. An increase of this magnitude among women with young children in California could potentially result in hundreds of thousands of additional workers joining the labor force.[25] The gains for low-income mothers were even higher in the DC study – a 15 percentage point boost. The participation rate for mothers with young children now matches the rate for those with school-age children in the region (Malik 2018).[26]
Empirical evidence from other countries echoes these findings. In the 1990s, Quebec invested in universal, low-cost ECE, beginning with preschool for 4-year-olds in 1997 and expanding to include infants and toddlers in 2000. A 2008 study of the program found that while ECE enrollment expanded by 14 percentage points, married women’s employment grew by 7.7 percentage points relative to other Canadian provinces. The study suggests access to ECE not only benefited women who were not in the workforce – it also helped existing workers take up higher quality care (Baker, Gruber, and Milligan 2008).[27] Studies from Spain, Belgium, Israel, and other countries demonstrate similar positive effects (McGrew 2018).
These studies demonstrate that greater ECE investment can bolster women’s labor force participation. Further research will be necessary to estimate the effects of California’s potential boost in employment. Fundamentally, however, a larger supply of high-quality ECE can help women enter and stay in the workforce, thus growing the state’s economy.
ECE Leads to Higher Earnings for Working Parents
Between 1979 and 2013, women’s annual working hours increased by 26.4 percent across all income levels in the United States. Rising wages and labor force participation contributed to this trend (Boushey and Vaghul 2016). However, women disproportionately take on low-wage jobs – particularly women of color (see Figure 9). In California, for example, Latinx women in the workforce are twice as likely as white women to earn less than two-thirds of the median full-time wage, or $14.71 per hour (Schumacher 2018). Low-wage work is associated with inconsistent work schedules, non-traditional hours, and high stress. Maintaining a job with these characteristics establishes a clear need for consistent, high-quality ECE (Entmacher et al. 2014).

Not only do many women participate in low-wage jobs, but an increasing share of them rely on their earnings to support their families. In 2016, approximately 35 percent of mothers in California were the primary or sole breadwinner for their household – a proportion that has more than tripled since 1967 (Schumacher 2018). Consequently, mothers’ earnings are central to the financial stability of households with children. When mothers take on work without steady ECE, however, their earning potential is reduced – triggering a need for additional public assistance in the form of MediCal, CalFresh, and other social safety net programs.
Many studies have documented the motherhood “penalty” to income. Women already earn lower wages than men, but an additional gap persists between mothers and childless women. Explanations for the penalty typically include differences like experience and part- or full-time status, but controlling for these factors still leaves a residual of 5 to 10 percent motherhood penalty per child. Researchers have investigated this gap by measuring variation in human capital, childbearing age, employer discrimination, and other potential causes, with mixed results in explaining the difference between childless women and mothers. Access to ECE remains an important driver of the continued gap (Gough and Noonan 2013).
The drag on mothers’ wages accumulates over the course of their careers. Research in 2012 focused on gaps in employment, finding time out of work or school explained 60 percent of the wage penalty relative to childless women. Lack of ECE can trigger or extend these gaps. The data currently available, however, leave unanswered questions about other mechanisms that may depress wage growth for parents. For instance, several studies suggest employers’ perceptions of lower commitment to work caused mothers to miss out on promotions and other opportunities. Additional research is needed to clarify ECE’s role in these mechanisms – for instance, to what degree women prefer or are redirected into part-time roles due to child care issues (Staff and Mortimer 2012; Gough and Noonan 2013).
Research points to a link between increasing access to quality ECE and greater earnings. According to a 2016 study, inadequate ECE is responsible for $8.3 billion in lost wages in the United States. This figure is likely an underestimate, as it includes only wages lost when a parent became unemployed or took part-time work due to a lack of child care. Other costs – such as depressed wages, foregone retirement savings, and unpaid leave – would balloon the estimate further. These lost wages largely accrue to women (Glynn and Corley 2016).
When parents gain access to quality ECE, their opportunities to earn can grow. A 2015 study looking across developed countries compared the number of infants in publicly-funded child care with the magnitude of the mother wage penalty. The authors noted that in countries with little or no public investment in ECE, the wage gap was 9.6 percent. An additional 10 percentage points of children age 0 to 3 in publicly-funded care corresponded to a decrease of 1 percentage point in the wage gap (Budig, Misra, and Boeckmann 2016). This translates to meaningful increases in earnings for working mothers. In Norway, for instance, a 2018 study of their universal ECE program found that women experienced an increase of $6,000 in annual wages in married households and $2,400 in single-parent households following the program’s rollout (McGrew 2018).
Increased earnings for parents translate into a reduction in child poverty. A 2019 study projected the national rate of child poverty in the U.S. could be halved by combining greater ECE funding with other benefits like an expanded Earned Income Tax Credit and Supplemental Nutrition Assistance Program. The report called for expanding the Child Care and Dependent Fund and strengthening the Child and Dependent Care Tax Credit (“A Roadmap to Reducing Child Poverty” 2019).
ECE Supports Businesses’ Bottom Line by Increasing Worker Productivity
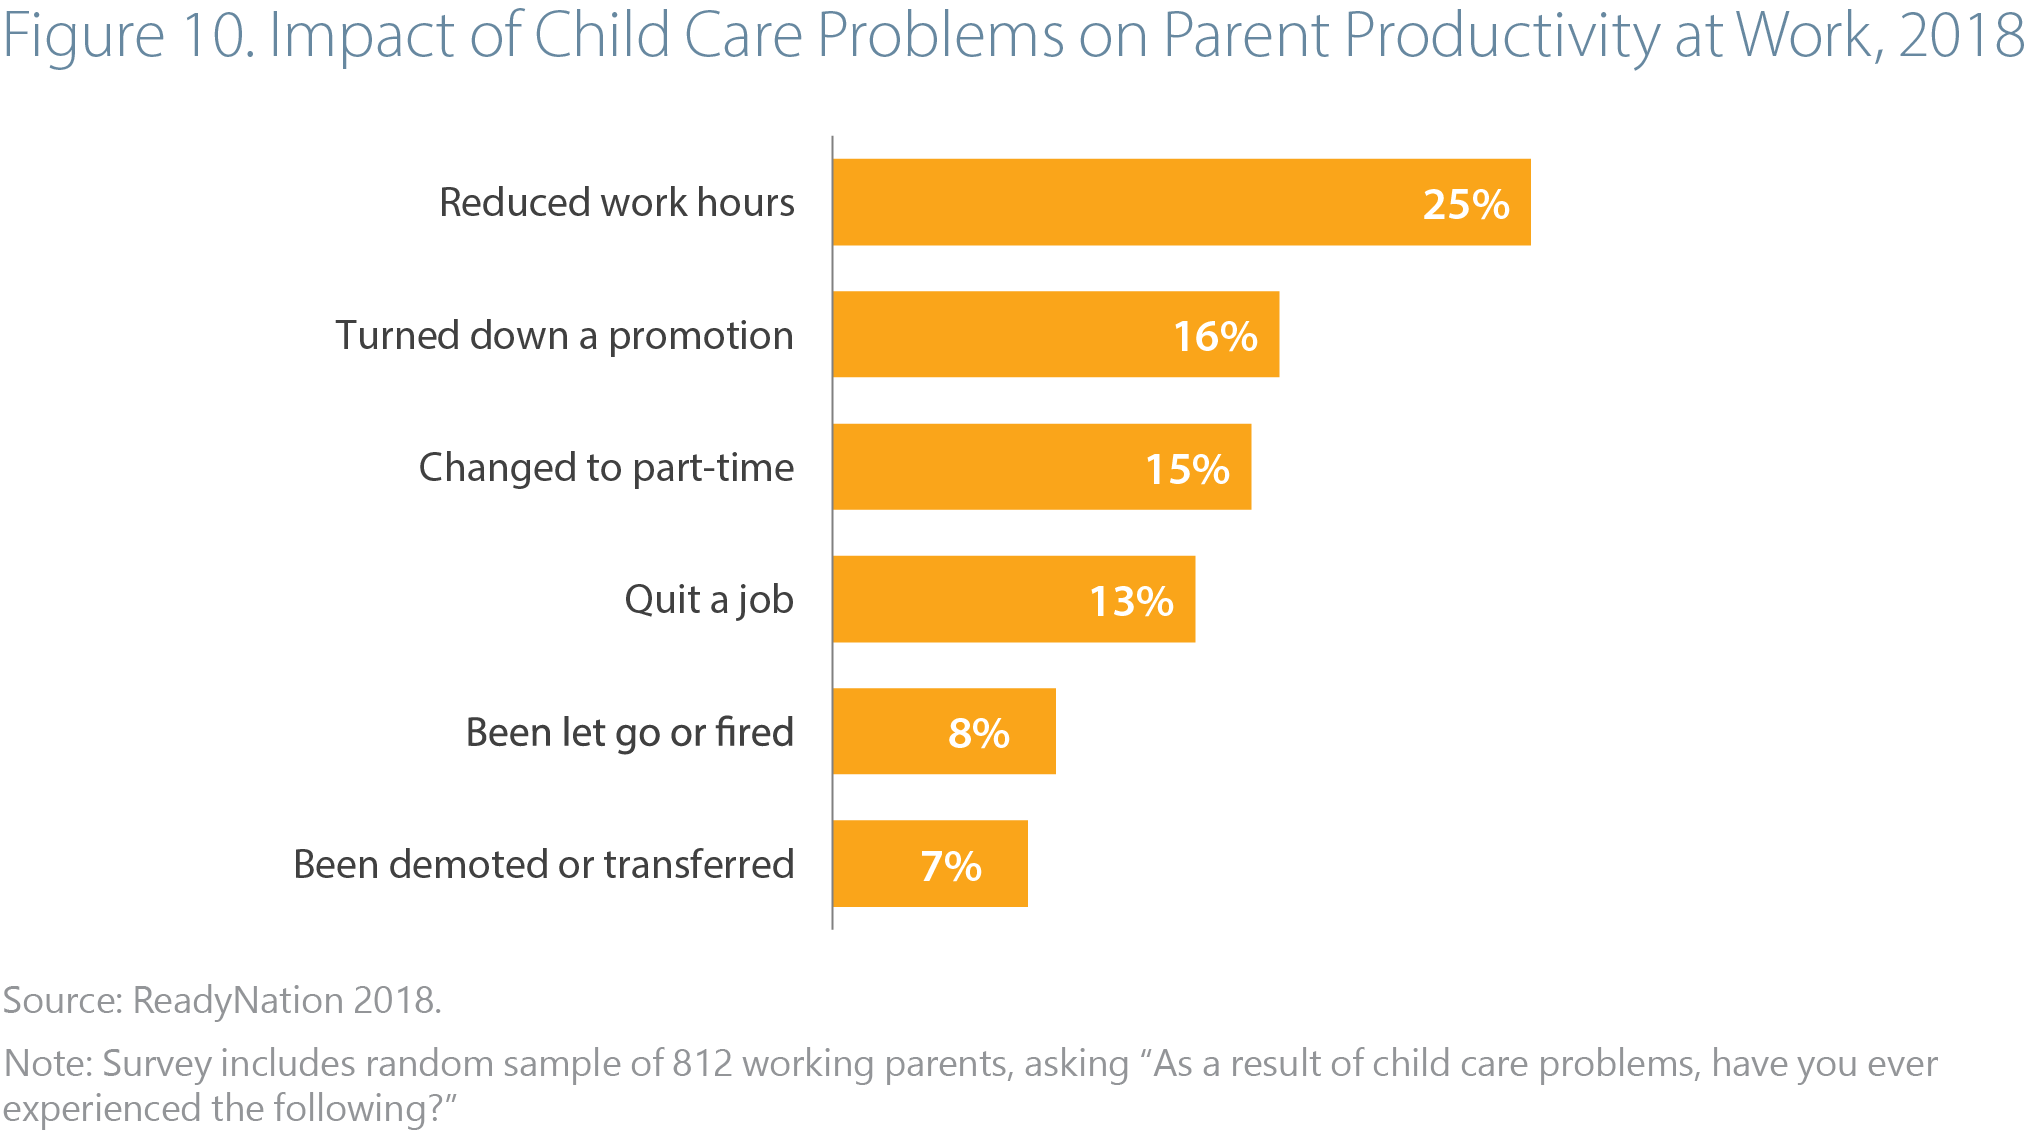
Increasing access to quality ECE means higher profits for businesses. When workers have access to stable child care, their output grows and turnover falls. Without reliable ECE, however, each working parent costs their employer an average of $1,150 on an annual basis, according to a 2018 study. The authors surveyed a random sample of working parents to explore the mechanisms of this loss. The responses in Figure 10 reveal that child care issues spawned a variety of negative impacts, including lower productivity and higher turnover (Belfield 2018).
Turnover takes a toll on employers. When a worker leaves a position due to problems finding stable child care, the business bears the cost of recruiting and training their replacement. Similar to the productivity survey, a 2017 report on the National Survey of Children’s Health found that 14.4 percent of parents with children under age five quit their job due to problems with child care. In the course of six months, 45 percent of employed parents miss at least one day of work due to a lack of child care, with an average of 4.3 days lost (Child Care Aware 2018). By contrast, a 2004 report found that making paid ECE available decreased employee absences by 20-30 percent and reduced turnover by 37-60 percent (Shellenback 2004).[28]
Public investment in ECE would help California improve the productivity of working parents throughout the economy. By expanding the overall supply of high-quality ECE, California can help businesses improve worker productivity and reduce child care-related turnover.
Conclusion
High-quality ECE is good for children, parents, workers, businesses, and California’s economy as a whole. Families are unable to cover the true cost of high-quality ECE on their own, making public investment necessary. However, the current level of funding in California is insufficient to retain enough high-quality providers and teachers or to provide care for all of the families who need it. As a result, we are losing out on the untapped potential of parents who want to work, or want to work more hours but are unable to do so because they lack access to affordable, high-quality ECE. Solving this problem will require that California target additional investments to increase the supply of providers, sustain program quality, and retain teachers. Raising wages will be necessary to expand access to high-quality child care, with parallel investments supporting the affordability of programs.
More funding would have an immediate positive effect on our state’s economy. Increased earnings of ECE providers would have a multiplier effect as they flow through local economies, and would bring in higher state and local tax revenues as well. Research on economic multipliers suggests that the net benefit would be positive – even before accounting for the range of other economic impacts. The effect on parents in particular could provide an even greater economic boost by bringing hundreds of thousands of mothers into the workforce and increasing parental earnings and productivity. Evidence shows that making affordable, high-quality ECE programs more widely available would be a powerful investment for growing California’s economy.
Appendix I: ECE Enrollments and Cost of Care
To describe the full scope of California’s ECE industry, we show annual ECE enrollments by provider type and subsidy status. We then compute cost of care by weighting different rates by age of enrollee and adjusting for part- or full-time status. Per the Cornell Methodology Guide, we take the product of our estimates to compute gross receipts for the ECE industry (Ribeiro and Warner 2004). The resulting estimates inform our IMPLAN analysis, which we describe in the subsequent appendix.
Enrollments
No single data source captures all ECE arrangements for children age 0 to 12. The state budget and licensed capacity provide a snapshot of funded enrollment, but they may not reflect the actual supply of care. These sources are also unable to provide an estimate of license-exempt, unsubsidized care. We turn instead to a combination of administrative and survey data to estimate the size of the ECE industry in California. The most recent publicly available data provide enrollments for the 2016-2017 school year.
We combine sources to calculate total enrollments and subsidized enrollments, generating an estimate of unsubsidized enrollments by taking the difference (see Table 2). Data on subsidized enrollments required some adjustment: the center- and FCC-based estimates derive from the 2012 National Survey of Early Care and Education (NSECE). To account for growth since 2012, we adjust these estimates by the increase in households claiming the Child Care credit from 2012 to 2016 (1.9 percent), using IRS data (Austin, Edwards, and Whitebook 2018; Internal Revenue Service 2017). The grand total enrollment estimate of 1.3 million derives from the authors’ analysis of a measure of children receiving paid care from the Current Population Survey (CPS) March Supplement (2015-2018).[29] We use this estimate because the NSECE may not capture the exempt caregiver population in full. We estimate the total license-exempt group of 405,000 as the difference between total enrollment and licensed care enrollment.

Cost of Care
One common approach to approximating cost of care for ECE is to leverage the 2016 Regional Market Survey, which is used by some subsidy programs to determine reimbursement rates. However, the actual cost of care can differ significantly depending on whether or not the child receives a subsidy and what type of setting they are in. Because of this, we have used different cost estimates for different types of care. Table 3 describes the full breakdown of rates.

SRR and RMR estimates are weighted using the proportions of enrollments by age, according to data from the California Department of Education (Early Learning and Care Division Data Team 2018). The cost of unsubsidized exempt care is also weighted to reflect the proportion of children by age in paid care based on Current Population Survey March Supplement, 2015-2018. In addition, RMR and SRR rates are adjusted to 91 percent to reflect the share of requests for full-time care according to California Resource & Referral (DiMatteo 2017). Head Start cost estimates come from the National Institute for Early Education Research in 2014-2015 (Barnett and Friedman-Krauss 2016). We have adjusted them for inflation using the CPI-W (Urban Wage Earners and Clerical Workers) for California.
New America’s Care Index offers an estimate for unsubsidized, license-exempt arrangements (Schulte and Durana 2016). The report aggregates hourly rates from Care.com listings, which we have adjusted for inflation using the CPI-W for California. To arrive at an annual cost estimate, we assume a 2.2:1 child to caregiver ratio, per the estimates of teachers and students in the 2012 National Survey of Early Care and Education (NSECE) on unlisted home care (Austin, Edwards, and Whitebook 2018). This estimate serves as a proxy for unsubsidized, license-exempt care.
Gross Receipts
Gross receipts are calculated as the product of cost and enrollments estimates, per the Cornell Methodology Guide (Ribeiro and Warner 2004).

Appendix II: IMPLAN Analysis
To obtain estimates for the dollars ECE creates in California’s economy through provider revenues, we use IMPLAN, a modeling software. Economic impacts fall into three categories: direct, indirect, and induced. Direct spending comprises of wages and other forms of output within ECE businesses. The day-to-day operations of providers, meanwhile, lead to indirect spending in food, materials, and operations necessary for providing care. Additionally, ECE revenues generate induced impacts: as child care teachers earn wages, their household spending also increases.
IMPLAN generates estimates for economic output in 2017 based on our analysis of gross receipts in the previous appendix. We allocate ECE’s direct output of $13.5 billion across two sectors in IMPLAN: the $789 million of gross receipts from Transitional Kindergarten is applied to 472 Elementary and Secondary Schools and the remainder of the gross receipts are applied to 487 Child Day Care Services. Based on our inputs, IMPLAN estimates total economic output of $25.4 billion, inferring a multiplier of 1.88 in California’s economy. In addition, these outputs generate $1.1 billion in state and local tax revenue.
References
“2017 California Head Start Profile.” 2017. State Fact Sheets. National Head Start Association. https://www.nhsa.org/files/resources/2017-fact-sheet_california.pdf.
“A Roadmap to Reducing Child Poverty.” 2019. Washington, DC: National Academies of Sciences, Engineering, and Medicine. http://sites.nationalacademies.org/dbasse/bcyf/reducing_child_poverty/index.htm.
Alliance for Early Childhood Finance. 2016. “Finance Strategies.” Alliance for Early Childhood Finance. 2016. http://www.earlychildhoodfinance.org/finance/finance-strategies.
Austin, Lea J.E., Bethany Edwards, and Marcy Whitebook. 2018. “California’s ECE Workforce: What We Know Now and the Data Deficit That Remains.” University of California, Berkeley: Center for the Study of Child Care Employment. http://cscce.berkeley.edu/californias-ece-workforce/.
Baker, Michael, Jonathan Gruber, and Kevin Milligan. 2008. “Universal Child Care, Maternal Labor Supply, and Family Well‐Being.” Journal of Political Economy 116 (4): 709–45. https://doi.org/10.1086/591908.
Barnett, W. Steven, and Allison H. Friedman-Krauss. 2016. “State(s) of Head Start.” The National Institute for Early Education Research. http://nieer.org/wp-content/uploads/2016/12/HS_Full_Reduced.pdf.
Bartik, Timothy J. 2017. “New Evidence on State Fiscal Multipliers: Implications for State Policies.” Working Paper 17–275. W.E. Upjohn Institute. https://doi.org/10.17848/wp17-275.
Belfield, Clive R. 2018. “The Economic Impacts of Insufficient Child Care on Working Families.” ReadyNation: Council for a Strong America.
Blau, Francine, and Lawrence Kahn. 2013. “Female Labor Supply: Why Is the US Falling Behind?” w18702. Cambridge, MA: National Bureau of Economic Research. https://doi.org/10.3386/w18702.
Boushey, Heather, and Kavya Vaghul. 2016. “Women Have Made the Difference for Family Economic Security.” Equitable Growth (blog). April 4, 2016. https://equitablegrowth.org/women-have-made-the-difference-for-family-economic-security/.
Budig, Michelle J., Joya Misra, and Irene Boeckmann. 2016. “Work–Family Policy Trade-Offs for Mothers? Unpacking the Cross-National Variation in Motherhood Earnings Penalties.” Work and Occupations 43 (2): 119–77. https://doi.org/10.1177/0730888415615385.
CA Assembly Blue Ribbon Commission on Early Childhood Education. 2019. “Final Report.” Sacramento, CA: California Assembly. https://speaker.asmdc.org/sites/speaker.asmdc.org/files/pdf/BRC-Final-Report.pdf.
Cascio, Elizabeth. 2017. “Public Investments in Child Care.” The 51%: Driving Growth through Women’s Economic Participation. The Hamilton Project.
Child Care Aware. 2018. “The US and the High Cost of Child Care: 2018.” Arlington, VA: Child Care Aware of America. https://cdn2.hubspot.net/hubfs/3957809/COCreport2018_1.pdf.
Cohn, D’Vera, Kim Parker, Gretchen Livingston, and Molly Rohal. 2014. “After Decades of Decline, A Rise in Stay-At-Home Mothers.” Social & Demographic Trends Project. Washington, D.C: Pew Research Center. https://www.pewresearch.org/wp-content/uploads/sites/3/2014/04/Moms-At-Home_04-08-2014.pdf.
“Current Population Survey (CPS) Data Supplements.” 2018. National Bureau of Economic Research. 2018. https://www.nber.org/data/current-population-survey-data.html.
DiMatteo, Gemma. 2017. “2017 California Child Care Portfolio.” California Child Care Resource & Referral Network. https://www.rrnetwork.org/california_child_care_portfolio.
DiMatteo, Gemma, and Keisha Nzewi. 2019. “FCCH Decline Webinar.” California Child Care Resource & Referral Network, February 20.
Early Learning and Care Division Data Team. 2018. “Child Care Annual Statewide Reports.” California Department of Education. 2018. https://www.cde.ca.gov/sp/cd/re/ccannualreports.asp.
EdBudget. 2018. “Child Care and Preschool Funding Rates by Rate System, Setting, and Age.” Child Care and Preschool. Legislative Analyst’s Office. https://lao.ca.gov/Education/EdBudget/Details/106.
Entmacher, Joan, Lauren Frohlich, Katherine Gallagher Robbins, Emily Martin, and Liz Watson. 2014. “Underpaid and Overloaded: Women in Low-Wage Jobs.” National Women’s Law Center.
“FFN Caregiver Workshops.” 2019. Alameda County. BANANAS. 2019. https://bananasbunch.org/ffn-caregiver-workshops/.
Flood, Sarah, Miriam King, Renae Rodgers, Steven Ruggles, and J. Robert Warren. 2018. “Integrated Public Use Microdata Series, Current Population Survey: Version 6.0.” Minneapolis, MN: IPUMS. https://doi.org/10.18128/d030.v6.0.
Glasmeier, Amy K. 2019. “Living Wage Calculator.” Massachusetts Institute of Technology. 2019. http://livingwage.mit.edu/states/06.
Glynn, Sarah Jane, and Danielle Corley. 2016. “The Cost of Work-Family Policy Inaction – Center for American Progress.” Center for American Progress. September 2016. https://www.americanprogress.org/issues/women/reports/2016/09/22/143877/the-cost-of-inaction/.
Godøy, Anna, Michael Reich, and Sylvia Allegretto. 2019. “Parental Labor Supply: Evidence from Minimum Wage Changes.” Working Paper 2019–03. Institute for Research on Labor and Employment, University of California, Berkeley. http://irle.berkeley.edu/parental-labor-supply-evidence-from-minimum-wage-changes/.
Gough, Margaret, and Mary Noonan. 2013. “A Review of the Motherhood Wage Penalty in the United States: Motherhood Wage Penalty.” Sociology Compass 7 (4): 328–42. https://doi.org/10.1111/soc4.12031.
Hoynes, Hilary, Jesse Rothstein, and Krista Ruffini. 2017. “Making Work Pay Better Through an Expanded Earned Income Tax Credit.” The Hamilton Project. http://www.hamiltonproject.org/papers/making_work_pay_better_through_an_expanded_earned_income_tax_credit.
Institute of Medicine and National Research Council. 2015. Transforming the Workforce for Children Birth Through Age 8: A Unifying Foundation. Washington, D.C.: National Academies Press. https://doi.org/10.17226/19401.
Jacobs, Ken, T. William Lester, and Laurel Lucia. 2010. “Budget Solutions and Jobs.” Center for Labor Research and Education. https://laborcenter.berkeley.edu/budget-solutions-and-jobs/.
Levya, Connie. 2019. Early Childhood Education: Reimbursement Rates. http://www.leginfo.legislature.ca.gov/faces/billNavClient.xhtml?bill_id=201920200SB174.
“License-Exempt Child Care.” 2019. San Francisco, CA: California Child Care Resource & Referral Network. https://rrnetwork.org/assets/general-files/License-exempt-care.pdf.
Malik, Rasheed. 2018. “The Effects of Universal Preschool in Washington, D.C.” Washington, D.C: Center for American Progress. https://www.americanprogress.org/issues/early-childhood/reports/2018/09/26/458208/effects-universal-preschool-washington-d-c/.
Manship, Karen, Aleksandra Holod, Heather Quick, Burhan Ogut, Iliana Brodziak de los Reyes, Jennifer Anthony, Jodi Jacobson Chernoff, et al. 2017. “The Impact of Transitional Kindergarten on California Students.” San Mateo, CA: American Institutes for Research. https://www.air.org/system/files/downloads/report/Transitional-Kindergarten-Final-Report-June-2017.pdf.
McCoy, Dana Charles, Hirokazu Yoshikawa, Kathleen M. Ziol-Guest, Greg J. Duncan, Holly S. Schindler, Katherine Magnuson, Rui Yang, Andrew Koepp, and Jack P. Shonkoff. 2017. “Impacts of Early Childhood Education on Medium- and Long-Term Educational Outcomes.” Educational Researcher 46 (8): 474–87. https://doi.org/10.3102/0013189X17737739.
McGrew, Will. 2018. “Universal Childcare’s Benefits Might Cover Much of Its Costs.” Equitable Growth (blog). August 13, 2018. https://equitablegrowth.org/universal-childcares-benefits-might-cover-much-of-its-costs/.
Melnick, Hanna, Titilayo Tinubu Ali, Madelyn Gardner, Anna Maier, and Marjorie Wechsler. 2017. “Understanding California’s Early Care and Education System.” Palo Alto, CA: Learning Policy Institute. https://learningpolicyinstitute.org/product/understanding-californias-early-care-education-system-report.
Meloy, Beth, Madelyn Gardner, and Linda Darling-Hammond. 2019. “Untangling the Evidence on Preschool Effectiveness: Insights for Policymakers.” Palo Alto, CA: Learning Policy Institute. https://learningpolicyinstitute.org/product/untangling-evidence-preschool-effectiveness-report.
Mitchell, Anne, and Louise Stoney. 2010. “Lessons from Cost Modeling: The Link Between ECE Business Management and Program Quality.” Alliance for Early Childhood Finance. http://www.earlychildhoodfinance.org/downloads/2010/Lessons%20from%20Cost%20Modeling7.27.10.pdf.
“Monitoring License-Exempt CCDF Homes.” 2015. Fairfax, Virginia: National Center on Early Childhood Quality Assurance. https://childcareta.acf.hhs.gov/sites/default/files/public/monitoring_exempt_ccdf_homes_0.pdf.
National Research Council, ed. 2012. The Early Childhood Care and Education Workforce: Challenges and Opportunities: A Workshop Report. Washington, D.C: National Academies Press.
Petek, Gabriel. 2019. “The 2019-20 Budget: Early Education Analysis.” Legislative Analyst’s Office.
Porter, Noriko. 2012. “High Turnover among Early Childhood Educators in the United States.” Washington State University. https://www.childresearch.net/projects/ecec/2012_04.html.
Ribeiro, R, and M Warner. 2004. “Measuring the Regional Importance of Early Care and Education: The Cornell Methodology Guide.”
Sall, Sean P. 2014. “Maternal Labor Supply and the Availability of Public Pre-K.” Economic Inquiry 52 (1): 17–34. https://doi.org/10.1111/ecin.12002.
San Francisco Parent Voices Meeting. 2018.
Schochet, Leila. 2019. “The Child Care Crisis Is Keeping Women Out of the Workforce.” Washington, D.C: Center for American Progress. https://www.americanprogress.org/issues/early-childhood/reports/2019/03/28/467488/child-care-crisis-keeping-women-workforce/.
Schulte, Brigid, and Alieza Durana. 2016. “The Care Report.” Washington, D.C.: New America. https://www.newamerica.org/in-depth/care-report/.
Schumacher, Kristin. 2018. “Supporting Working Mothers in California.” Sacramento, CA: California Budget & Policy Center. https://calbudgetcenter.org/wp-content/uploads/WWBI-Issue-Briefs_All_June2018.pdf.
———. 2019. “Millions of Children Are Eligible for Subsidized Child Care, but Only a Fraction Received Services in 2017.” California Budget & Policy Center. January 28, 2019. https://calbudgetcenter.org/resources/millions-of-children-are-eligible-for-subsidized-child-care-but-only-a-fraction-received-services-in-2017/.
Shellenback, Karen. 2004. “Child Care & Parent Productivity: Making the Business Case.” Cornell University: Linking Economic Development & Child Care Research Project. http://s3.amazonaws.com/mildredwarner.org/attachments/000/000/074/original/154-21008542.pdf.
Staff, Jeremy, and Jeylan T. Mortimer. 2012. “Explaining the Motherhood Wage Penalty During the Early Occupational Career.” Demography 49 (1): 1–21. https://doi.org/10.1007/s13524-011-0068-6.
Stipek, Deborah. 2018. “Early Childhood Education in California: Technical Report.” Getting Down to Facts II. Stanford University: Policy Analysis for California Education. https://gettingdowntofacts.com/publications/early-childhood-education-california.
Susman-Stillman, Amy, and Patti Banghart. 2011. “Quality in Family, Friend, and Neighbor Child Care Settings.” Child Care & Early Education Research Connections.
Taylor, Mac. 2017. “The 2017-18 Budget: Analysis of Child Care and Preschool Proposals.” Legislative Analyst’s Office. http://www.lao.ca.gov/Publications/Report/3618.
Thomason, Sarah, and Annette Bernhardt. 2016. “Technical Brief: Estimating the Costs of Raising Child Care Workers’ Wages for State Subsidy Programs.” UC Berkeley Labor Center. https://laborcenter.berkeley.edu/pdf/2016/Raising-Child-Care-Workers-Wages.pdf.
“Transitional Kindergarten Data.” 2018. CA Deptment of Education. 2018. https://www.cde.ca.gov/ds/sd/sd/filestkdata.asp.
Tyson, Tony. 2018. Early Learning Scholarship Interview.
U.S. Department of Health and Human Services. 2016. “High-Quality Early Learning Settings Depend on a High-Quality Workforce.” Washington, D.C.: U.S. Department of Health and Human Services. https://www2.ed.gov/about/inits/ed/earlylearning/files/ece-low-compensation-undermines-quality-report-2016.pdf.
Whitebook, Marcy, Caitlin McLean, Lea J.E. Austin, and Bethany Edwards. 2018. “The Early Childhood Workforce Index 2018.” University of California, Berkeley: Center for the Study of Child Care Employment. http://cscce.berkeley.edu/early-childhood-workforce-2018-index/.
Whitebook, Marcy, and Laura Sakai. 2003. “Turnover Begets Turnover: An Examination of Job and Occupational Instability among Child Care Center Staff.” Early Childhood Research Quarterly 18 (3): 273–93. https://doi.org/10.1016/S0885-2006(03)00040-1.
Workman, Simon. 2018. “Where Does Your Child Care Dollar Go?” Washington, D.C.: Center for American Progress. https://www.americanprogress.org/issues/early-childhood/reports/2018/02/14/446330/child-care-dollar-go/.
Zepeda, Alex. 2015. “Stability of Teaching Staff in LAUP Programs.” Los Angeles Universal Preschool: Research and Evaluation Department. https://child360.org/wp-content/uploads/2017/01/LAUP_WD_FULLREPORT_STABILITY_rev20160330.pdf.
Endnotes
[1] Using IPUMS Current Population Survey Basic Monthly (2018), we estimate that approximately 62 percent of the 1.4 million women with young children in California were in the labor force, meaning a 10 percentage point increase would potentially bring in hundreds of thousands of workers.
[2] We used the “needed paid child care” variable in the Current Population Survey March Supplement (2015-2018) to estimate that 1.3 million children in California age 0 to 12 receive paid care. For more information on our methodology of breaking down ECE enrollments, see Appendix I.
[3] Authors’ analysis of Current Population Survey March Supplement (2015-2018). Appendix I describes the methodology for estimating license-exempt care.
[4] Quality Counts is California’s Quality Rating and Improvement System (QRIS). Initially launched as a pilot in 16 counties, this program will be expanded statewide.
[5] The California Resource & Referral Network defines potential demand for ECE as the number of children in families where all parents work. Using Census data, they estimate this population to be 4.23 million children in 2017.
[6] For a description of our methodology, see Appendix I.
[7] TK launched in 2014-2015 with significant variation across the state. Roughly two thirds of programs are full-day, though none of them operate full-year. TK classrooms do not follow licensing requirements for child care programs; instead, they follow kindergarten standards, including an average ratio of 1:20 for adults to children, compared to the required center-based ratio of 1:12 (Manship et al. 2017).
[8] For our methodology on enrollments, refer to the Appendices. Because TK operates in alignment with the K-12 system, we separate TK from other forms of ECE when discussing licensed capacity and paid care. Our models for the gross receipts and economic multipliers, however, include TK.
[9] The 4.2 million estimate for total demand for child care comes from California Resource & Referral’s 2017 Portfolio; estimates of total in paid care comes from authors’ estimates using the Current Population Survey March Supplement (2015-2018) and 2012 National Survey of Early Care and Education (NSECE). Potential unmet need is calculated as the difference between total demand and enrollees in paid care.
[10] State Preschool also comes in a mix of part- and full-day. Since 91 percent of resource and referral requests were for full-day care in 2017, unused State Preschool dollars could be due to both supply and demand challenges.
[11] Quality Counts, California’s QRIS, is undergoing renovation. The current local system has five tiers, with a statewide rollout of a continuum-based rather than tier-based framework anticipated in 2020.
[12] We use data from the 2018 Occupational Employment Statistics to arrive at this estimate. We include counts of Childcare Workers in the Child Day Care Services, Elementary and Secondary Schools, Religious Organizations, and Colleges and Universities industries; we also include Preschool Teachers, Kindergarten Teachers, and Teacher Assistants in the Child Day Care Services industry. These data offer an incomplete picture of employment in ECE, however, since they likely exclude many family child care and license-exempt providers.
[13] The Census and the Bureau of Labor Statistics typically identify ECE teachers as one of these two positions. In practice, ECE job titles may vary, including “aides,” “lead teachers,” and more. Our data are unable to fully parse these specific categories.
[14] While a parent with one child in California would need $30.23, a single adult must earn $14.61 per hour in order to afford a minimal savings lifestyle (Glasmeier 2019). Meanwhile, kindergarten teachers earn higher wages due to their employment through the K-12 school system, which requires higher educational attainment.
[15] This estimate is based on American Community Survey data and uses both wages and self-employment income to estimate hourly wages. As self-employment income is known to be significantly underreported, this data point is likely an underestimate.
[16] Families who receive a voucher tied to the Regional Market Rate have the option of taking up license-exempt care – typically a family, friend, or neighbor (FFN). According to California law, the value of the voucher for an exempt provider may not exceed 70 percent of the rate of a licensed family child care home. In practice, however, this does guarantee FFN caregivers earn the cap; instead, current appropriations deliver 30 percent of the FCC rate, leading to an hourly wage as low as $3 depending on the age of the child and county of residence.
[17] Growing the supply of teachers will be necessary for the overall ECE system to grow; however, setting higher wages without providing public funding to keep ECE affordable could slow the expansion. Policymakers should focus on raising teacher wages and maintaining affordability for parents simultaneously.
[18] For FCC-based infants, California is third-least affordable; for preschoolers, California is 13th for centers and 4th for FCCs. California state law mandates staff ratios that contribute to these costs – for instance, a ratio of only four infants per teacher. Our estimates of average costs are weighted using enrollments by age and adjusted for part- or full-time status. See Appendix I for methodology.
[19] Cost burden by provider type is based on authors’ analysis of the 2016-2017 regional market rate in California and the Current Population Survey March Supplement (2015-2018).
[20] Estimates of middle- and upper-income cost burden are based on author’s analysis of the Current Population Survey March Supplement (2015-2018).
[21] To monitor trends in employment, the Bureau of Labor Statistics tracks the labor force participation rate, or the proportion of civilian Americans currently working or seeking a job. This differs from the unemployment rate, which examines the rate of joblessness within the population who are participating.
[22] Prime-age women are defined as age 25-54. The 2017-2018 increase in labor force participation among women with children under age five may be due in part to two statewide policy changes – an increase in the minimum wage and an expansion in the California EITC program. Recent studies have shown that both of these policies will increase the labor force participation of mothers (Godøy, Reich, and Allegretto 2019; Hoynes, Rothstein, and Ruffini 2017).
[23] Our analysis of labor force participation uses data in the Current Population Survey Basic Monthly (2018) for California (Flood et al. 2018).
[24] The estimates refer to mothers of children age 4, with no younger children in the household. The author used data from the American Community Survey (2005-2006). Estimates are statistically significant (p<0.01), but they represent an observational estimate rather than a causal claim.
[25] Using IPUMS Current Population Survey Basic Monthly (2018), we estimate that in 2018 approximately 62 percent of the 1.4 million women with young children in California were in the labor force, meaning a 10 percentage point increase would potentially bring in hundreds of thousands of workers.
[26] Women with children under 5 previously lagged school-age parents by 15 percentage points.
[27] Some parents may have switched from license-exempt care. While many parents prefer friend, family, and neighbor care, these arrangements may offer greater convenience, rather than quality.
[28] Shellenback provides a literature review of the “business case” for ECE, with a focus on paid, onsite ECE programs (2004).
[29] To perform our analysis of enrollments and costs, we analyzed Census data from the Current Population Survey March Supplement (2015-2018), which is sometimes called as the Annual Social and Economic Supplement (“Current Population Survey (CPS) Data Supplements” 2018).
Acknowledgements:
Thank you to Michael Duke, Angie Garling, Michael Reich, and Sissy Wood for reading and providing feedback on our paper. We are also grateful to Laurel Lucia, whose expertise with IMPLAN supported our analysis.
Additional Thanks:
Sarah Burtner
Sara Cortez
Peggy Daly Pizzo
Gemma DiMatteo
Virginia Early
Bruce Fuller
Candace Hamilton Hester
Kym Johnson
Sarah Kinahan
Austin Land
Rob Manwaring
Hanna Melnick
Anne Morrison
Pat Sullivan
Tony Tyson
Marcy Whitebook
Helen Woodlee
Citation: Anna Powell, Sarah Thomason, and Ken Jacobs, “Investing in Early Care and Education: The Economic Benefits for California” (UC Berkeley Center for Labor Research and Education, May 2019), https://laborcenter.berkeley.edu/investing-early-care-education-economic-benefits-california.